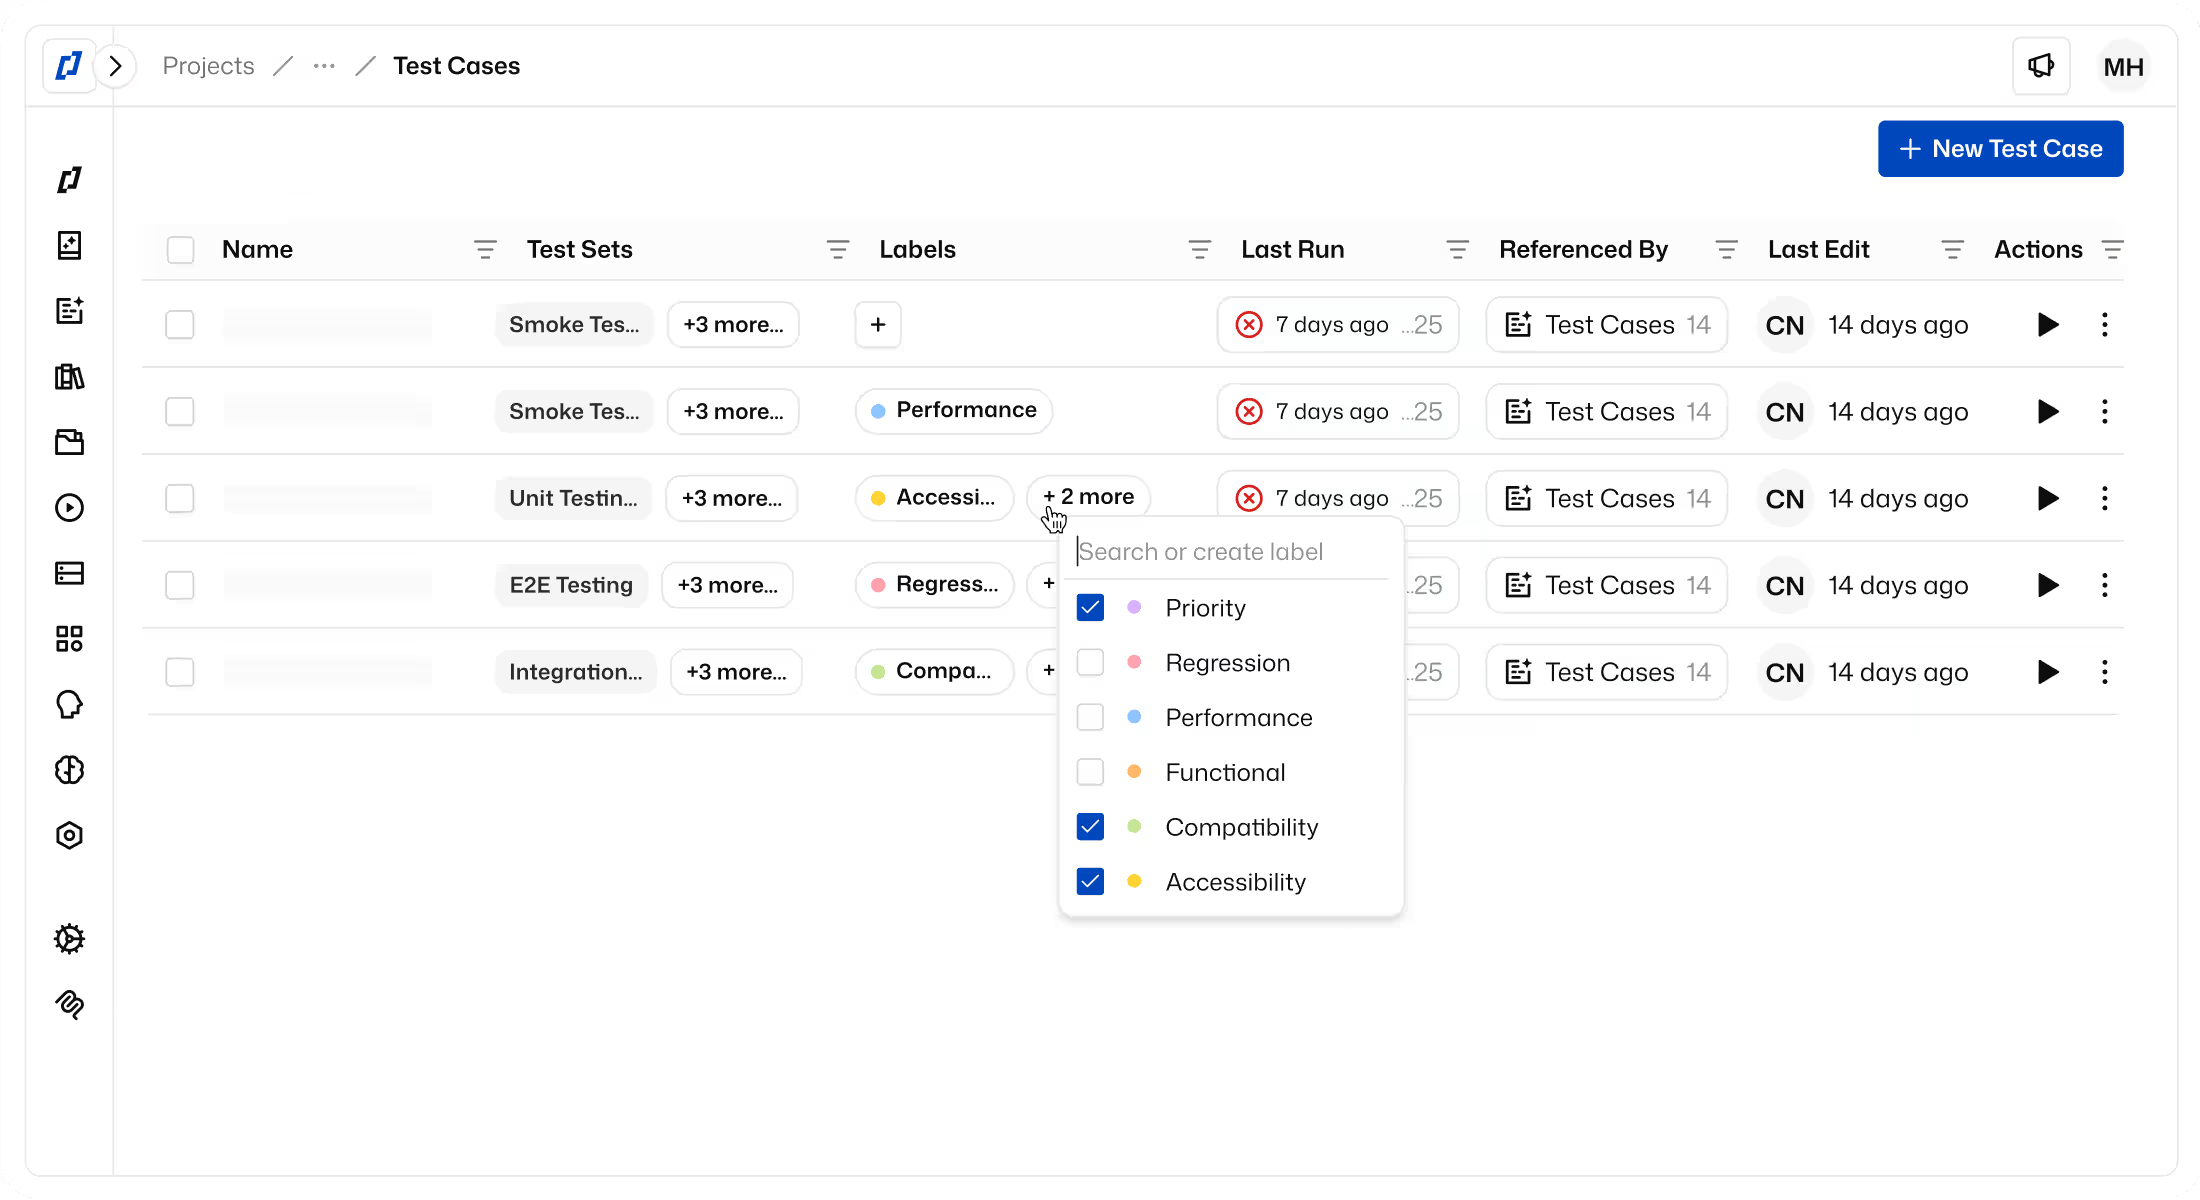
Failure Analysis & Debugging
Instant failure analysis. Reporting you can share. Thunders turns every test run into actionable insight so your team can make confident release decisions, communicate quality across the org, and improve with every run.












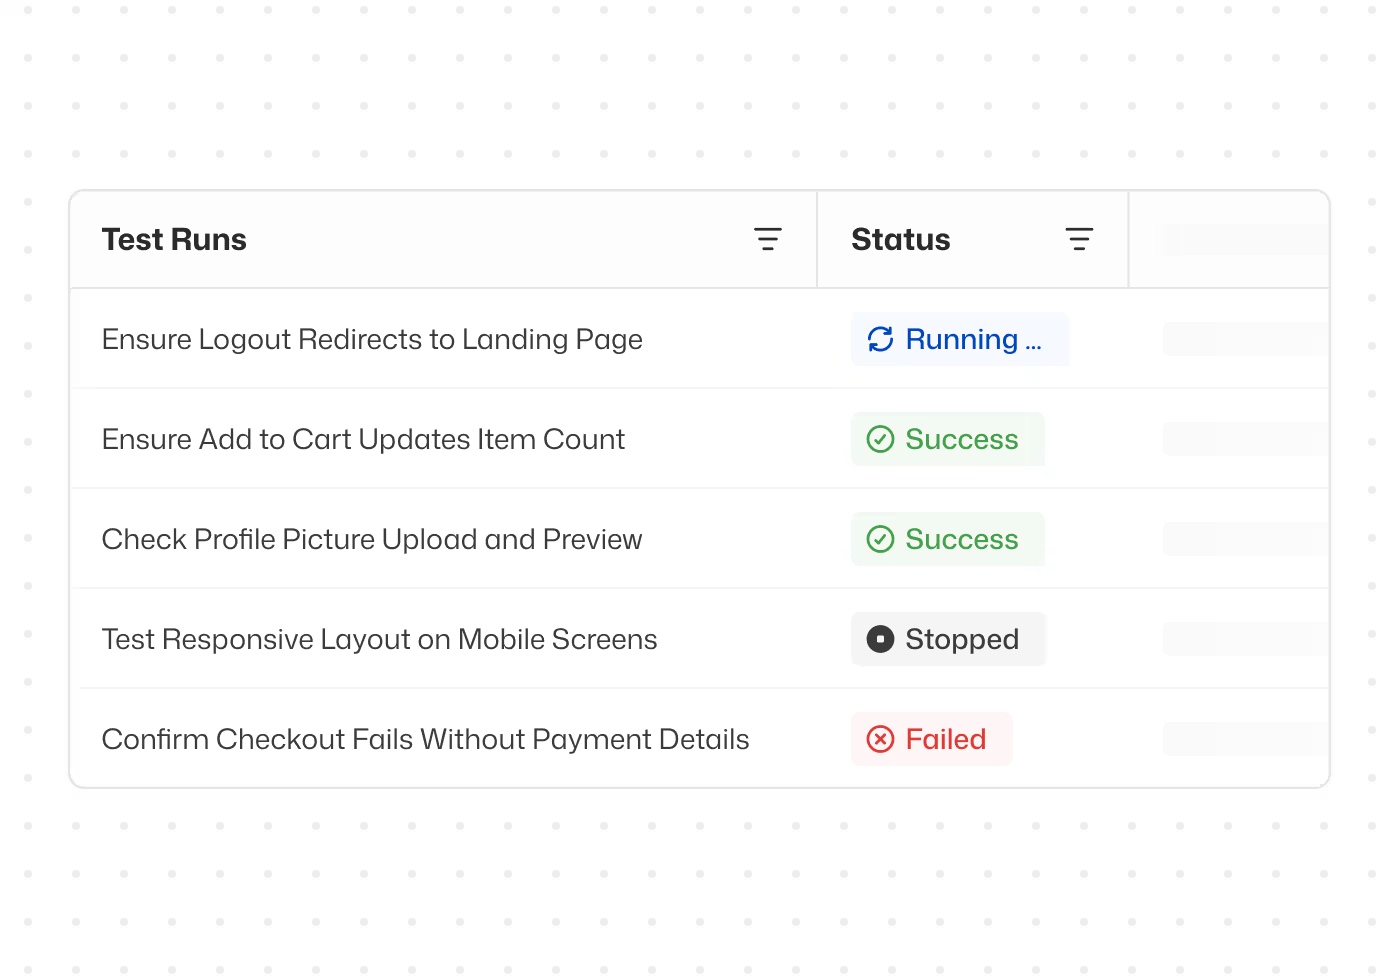
Why choose Thunders for Test Analysis & Insights

Go from test failure to root cause in seconds
When a test step fails, the AI persona that executed it explains exactly what happened, what was expected, and where the mismatch occurred.

Full visibility into what the AI persona did at every step
Every action the AI persona takes is traced and explained. You see how each step was interpreted, what decisions were made, and why. Complete transparency into how your tests run.

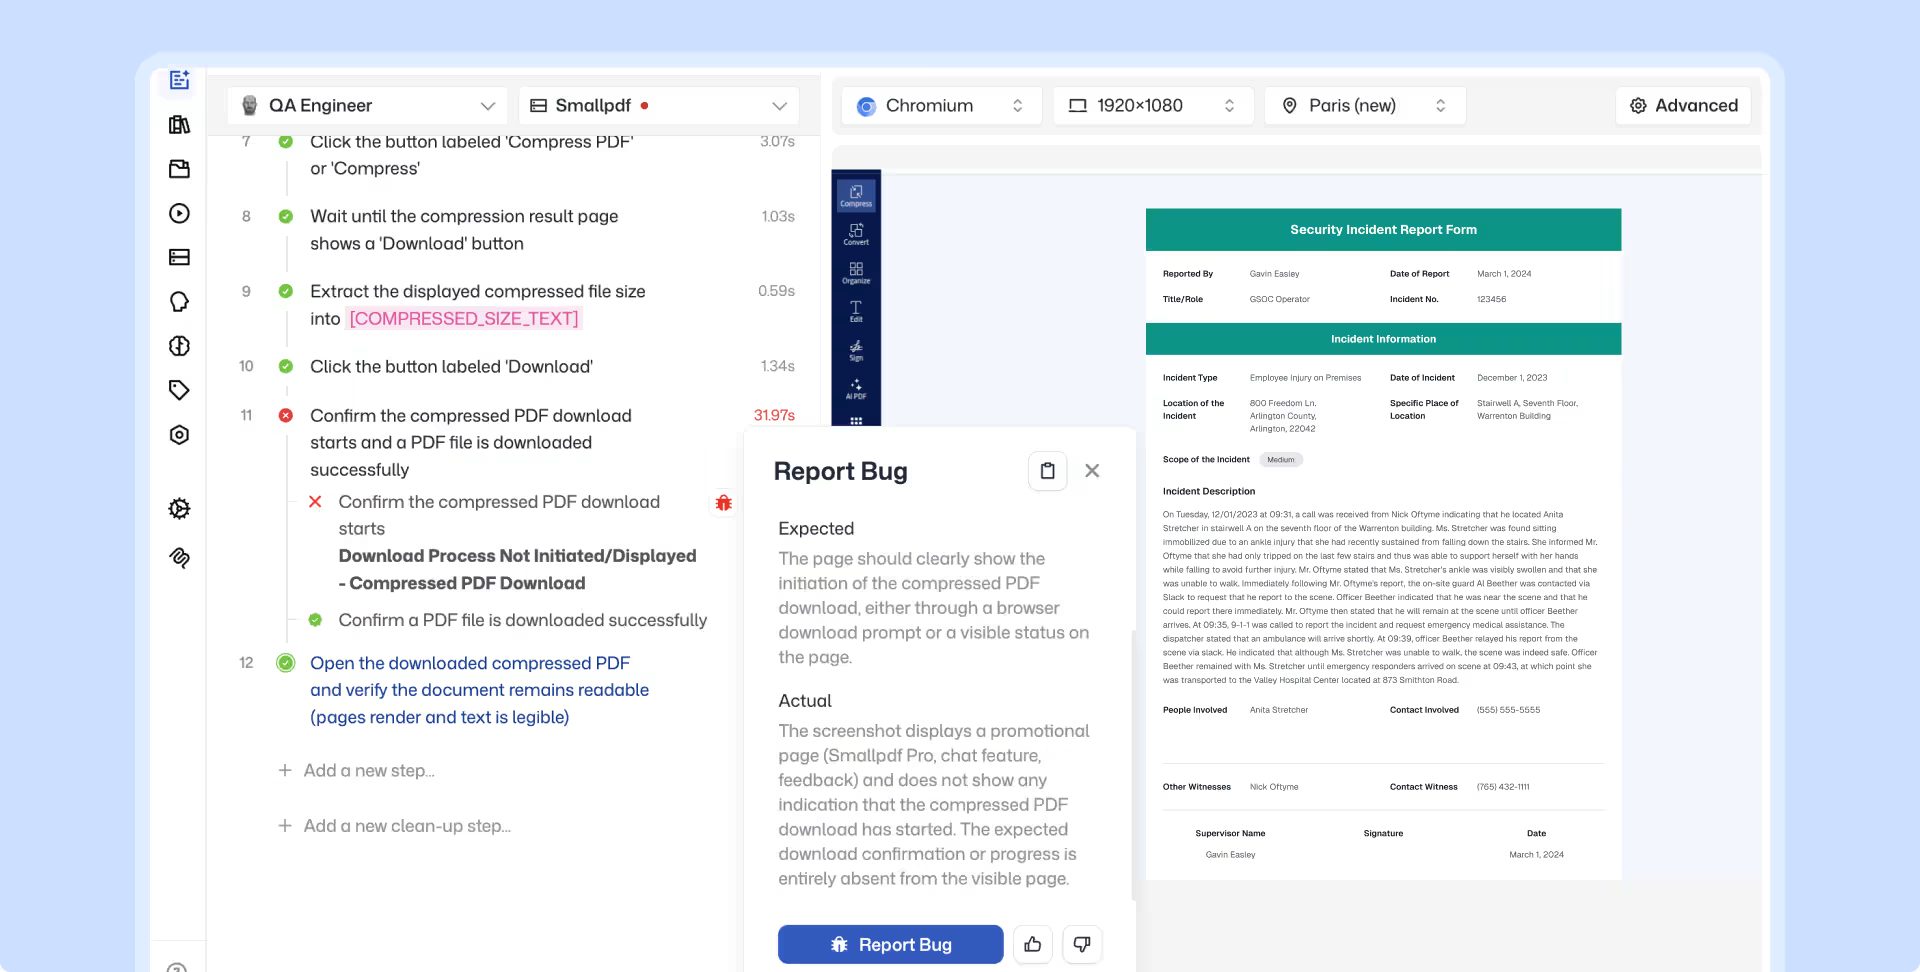
One-click bug reports with full failure context
Turn any failed step into a bug report in Jira, Linear, or Azure DevOps with one click. The report arrives pre-filled with screenshots, expected vs. actual results, and the full execution path.

Get a second pair of eyes on every test with Thunders AI
Thunders AI reviews your test descriptions like a senior QA would. It helps sharpen intent so your tests produce more accurate results over time.

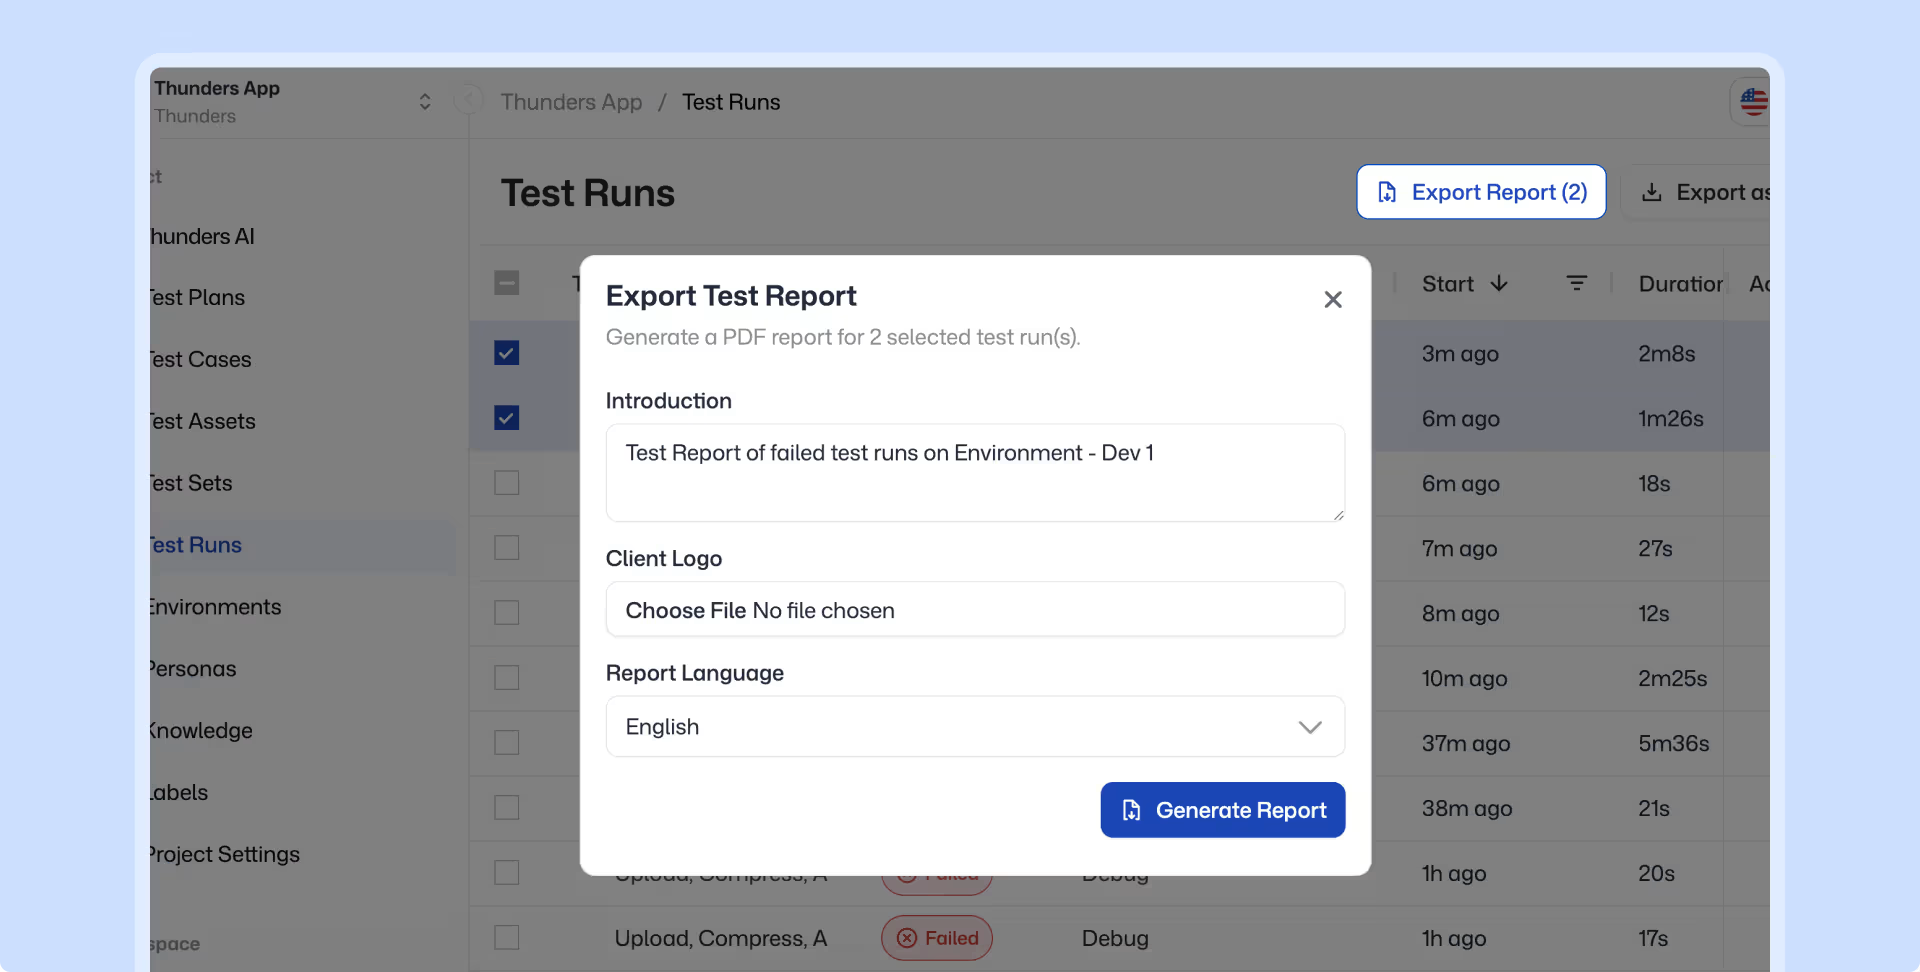
Export execution results as shareable reports
Export test results with step outcomes, screenshots, and pass/fail summary. Share them with product, engineering, or leadership.

Build custom dashboards and analytics through Thunders MCP
Connect any MCP-compatible AI assistant to your Thunders account. Build interactive dashboards from test data, and get the answer in seconds.
Test Analysis & Insights Use Cases
A test in the regression suite failed. The AI persona that executed it shows which step failed, what it expected, and why. One click turns it into a bug report in Jira or Linear, ready to triage.
Product and engineering need to know where quality stands before the release. Export execution results as a shareable report with step outcomes, screenshots, and pass/fail summary. Ready to share, no manual assembly.
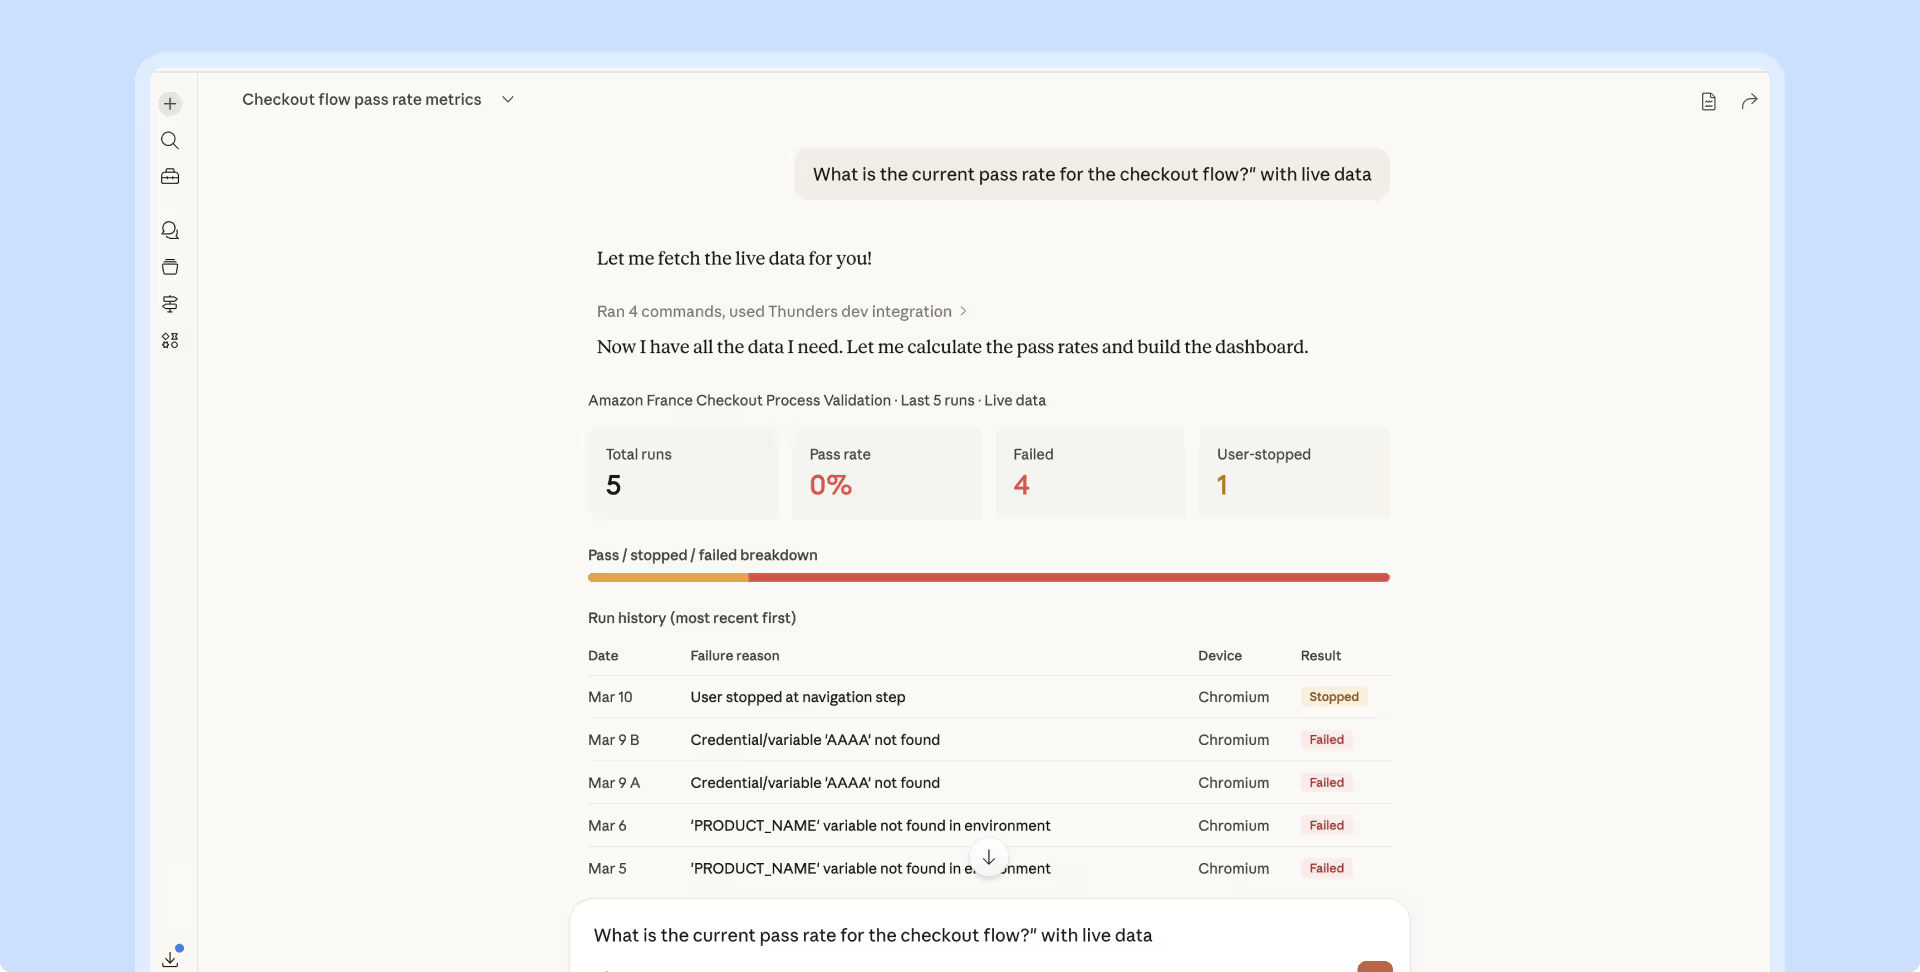
Leadership asks if you are ready to ship. Product wants to know if checkout is covered. Connect Thunders MCP to any AI assistant and answer from live test data. Build a dashboard if you need one, or get the answer in seconds.
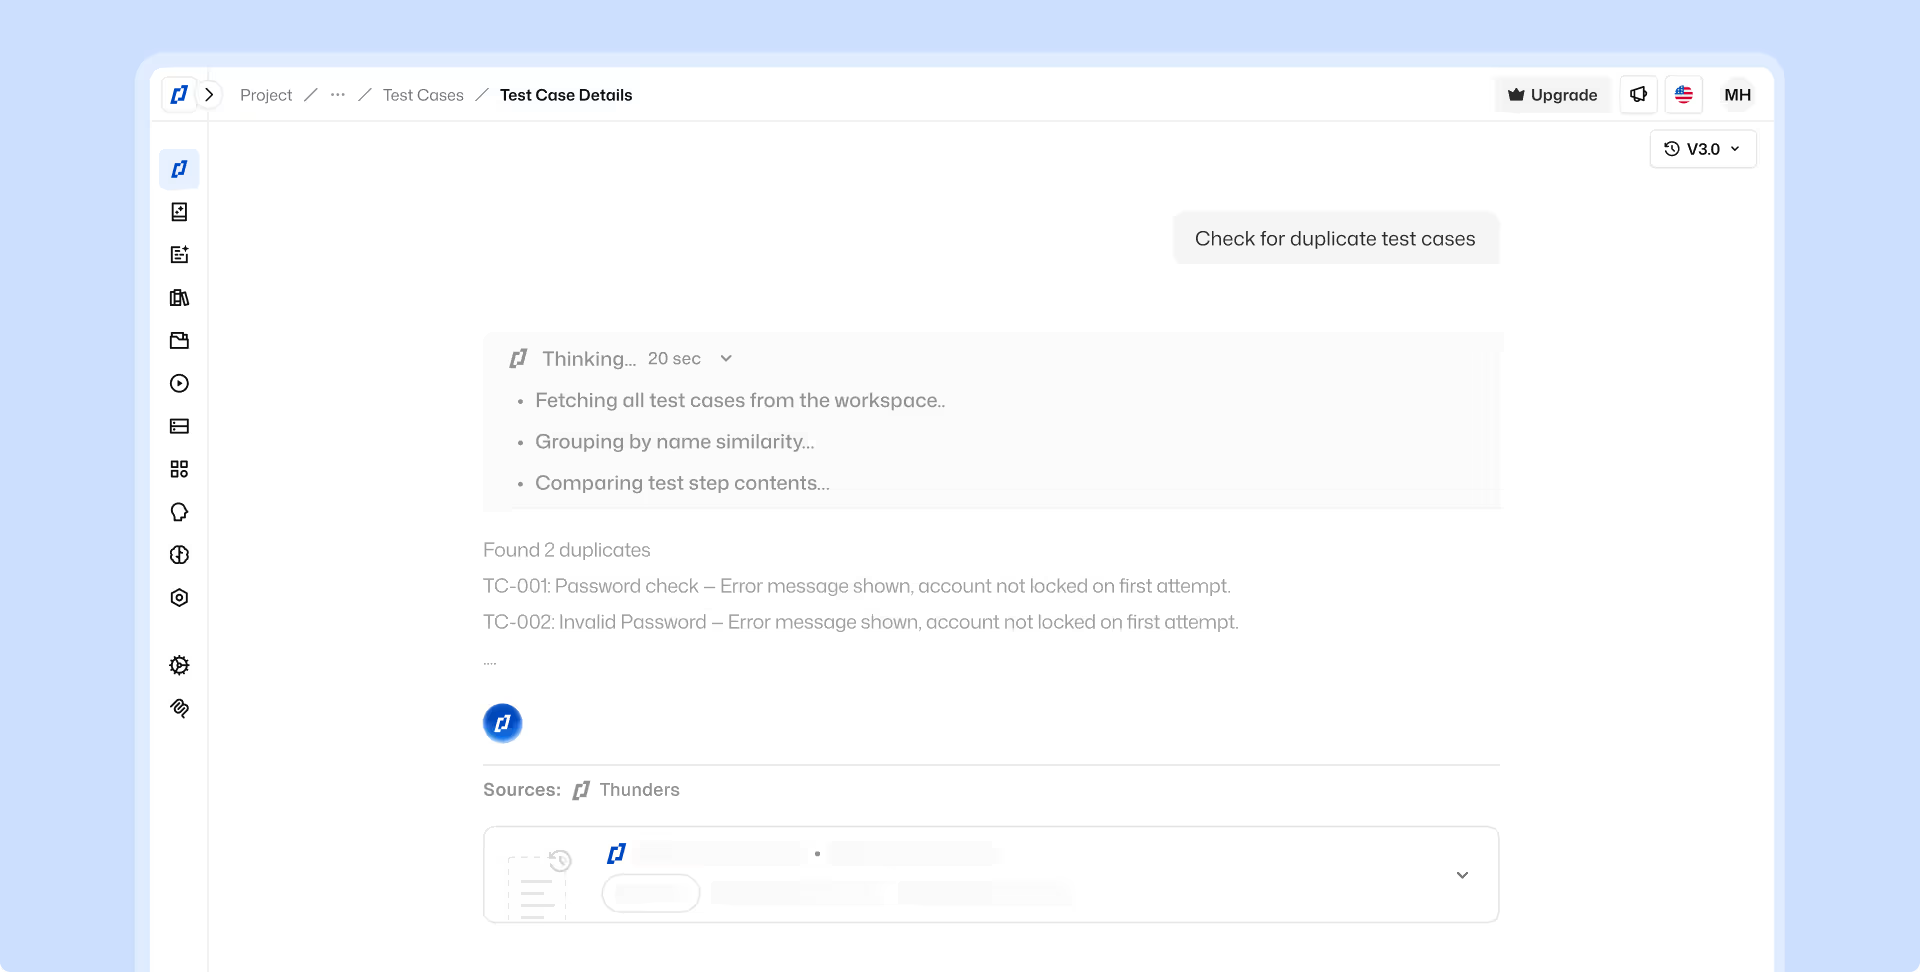
Thunders AI reviews your tests like a senior QA would. It catches vague scenarios, suggests edge cases, and spots duplicates. Over time, your suite gets sharper and your tests produce more accurate results.
Discover Thunders' features
Frequently Asked Questions
What is a test report and why is it important?
A test report is a summary document that presents the results of a test campaign: executed tests, successes, failures, detected defects, and achieved coverage. It serves as a benchmark to evaluate the quality of an application before going live and to communicate with stakeholders (developers, Product Owners, management). It plays a key role in traceability, regulatory compliance, and GO/NO-GO decision-making. Without a structured report, it is impossible to objectively measure the delivered quality.
What are the different types of test reports and their uses?
There are several types of reports tailored to different audiences: execution reports (technical view for testers), summary reports (managerial view for leaders), coverage reports (comprehensive view of the tested scope), defect reports (tracking anomalies), and compliance reports (RGAA, ISO, GDPR audits). Each report addresses a specific need: management, communication, auditing, or continuous improvement. Modern tools like Thunders.ai automatically generate these reports based on the user's profile.
How do you automatically generate test reports with modern tools?
Automatic generation relies on integrating testing tools with reporting platforms capable of collecting, aggregating, and visualizing results. AI can enrich these reports by identifying trends, prioritizing critical defects, and offering recommendations. Most modern solutions provide interactive dashboards, PDF exports, and integrations with Jira, Slack, or Teams. The goal is to transform raw data into actionable information in real time.
What essential information must a test report contain?
A relevant test report must include: the tested scope, the list of executed test cases, statuses (success, failure, ignored), detected defects with their severity, functional and code coverage, as well as the tested environments. It must also mention execution conditions, residual risks, and recommendations. Visual clarity (charts, color-coded indicators) facilitates quick reading by decision-makers.
How do you analyze and interpret the results presented in a report?
Analysis begins by examining overall indicators: pass rates, trends compared to previous campaigns, and defect concentration. Next, you must dive into recurring anomalies to identify high-risk areas and root causes. Interpretation should always cross-reference multiple angles: technical, functional, and business. A good analysis leads to concrete actions, not just a statement of facts.
How do you integrate test reports into a CI/CD process?
Integration consists of automating report generation and distribution at every pipeline execution. Results are published on a centralized dashboard, sent via notifications (Slack, Teams, email), and archived for traceability. Quality gates can block a release if certain criteria are not met. This approach allows teams to react immediately to regressions and maintain a high level of quality.
What quality indicators should be tracked in reports?
Key indicators include test pass rates, code coverage, defect density, mean time to resolution (MTTR), the number of regressions, and test suite stability (flakiness). For a complete view, business indicators must also be tracked: user satisfaction, production incidents, and delivery times. These KPIs feed quality reviews and guide the testing strategy.
How do you improve the readability and usefulness of test reports?
Readability comes from a clear hierarchy of information: a summary at the top, followed by details. The use of visualizations (charts, heatmaps, trend lines) facilitates immediate understanding. The level of detail must be adapted to the target audience: an executive dashboard differs from a technical report. Finally, the usefulness of the report depends on its ability to trigger actions: concrete recommendations, defect prioritization, and direct links to anomalies.
Ready to ship faster with smarter testing?