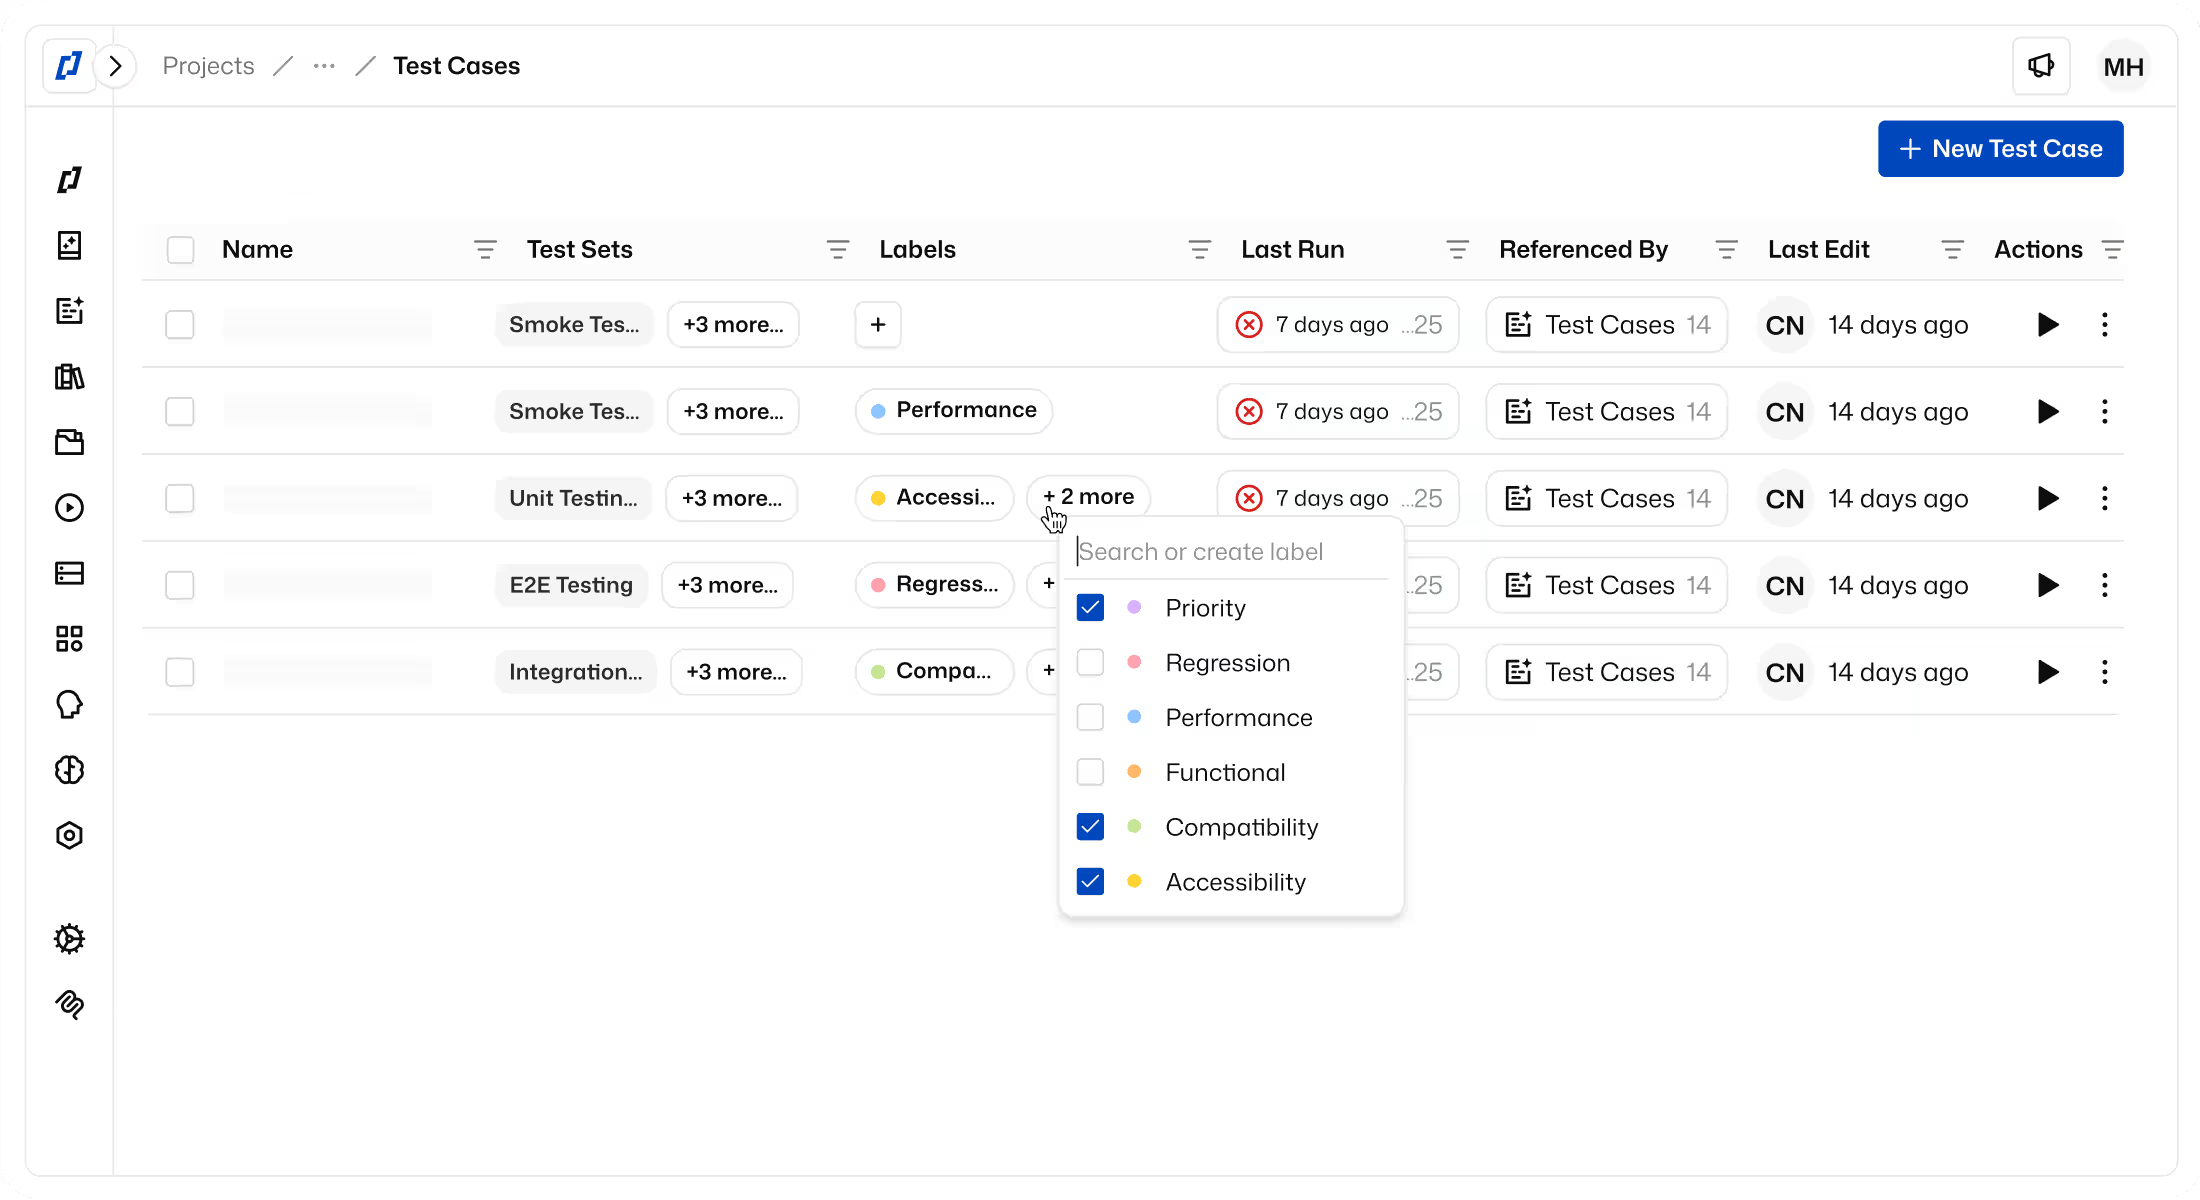
See how testing is going across your project
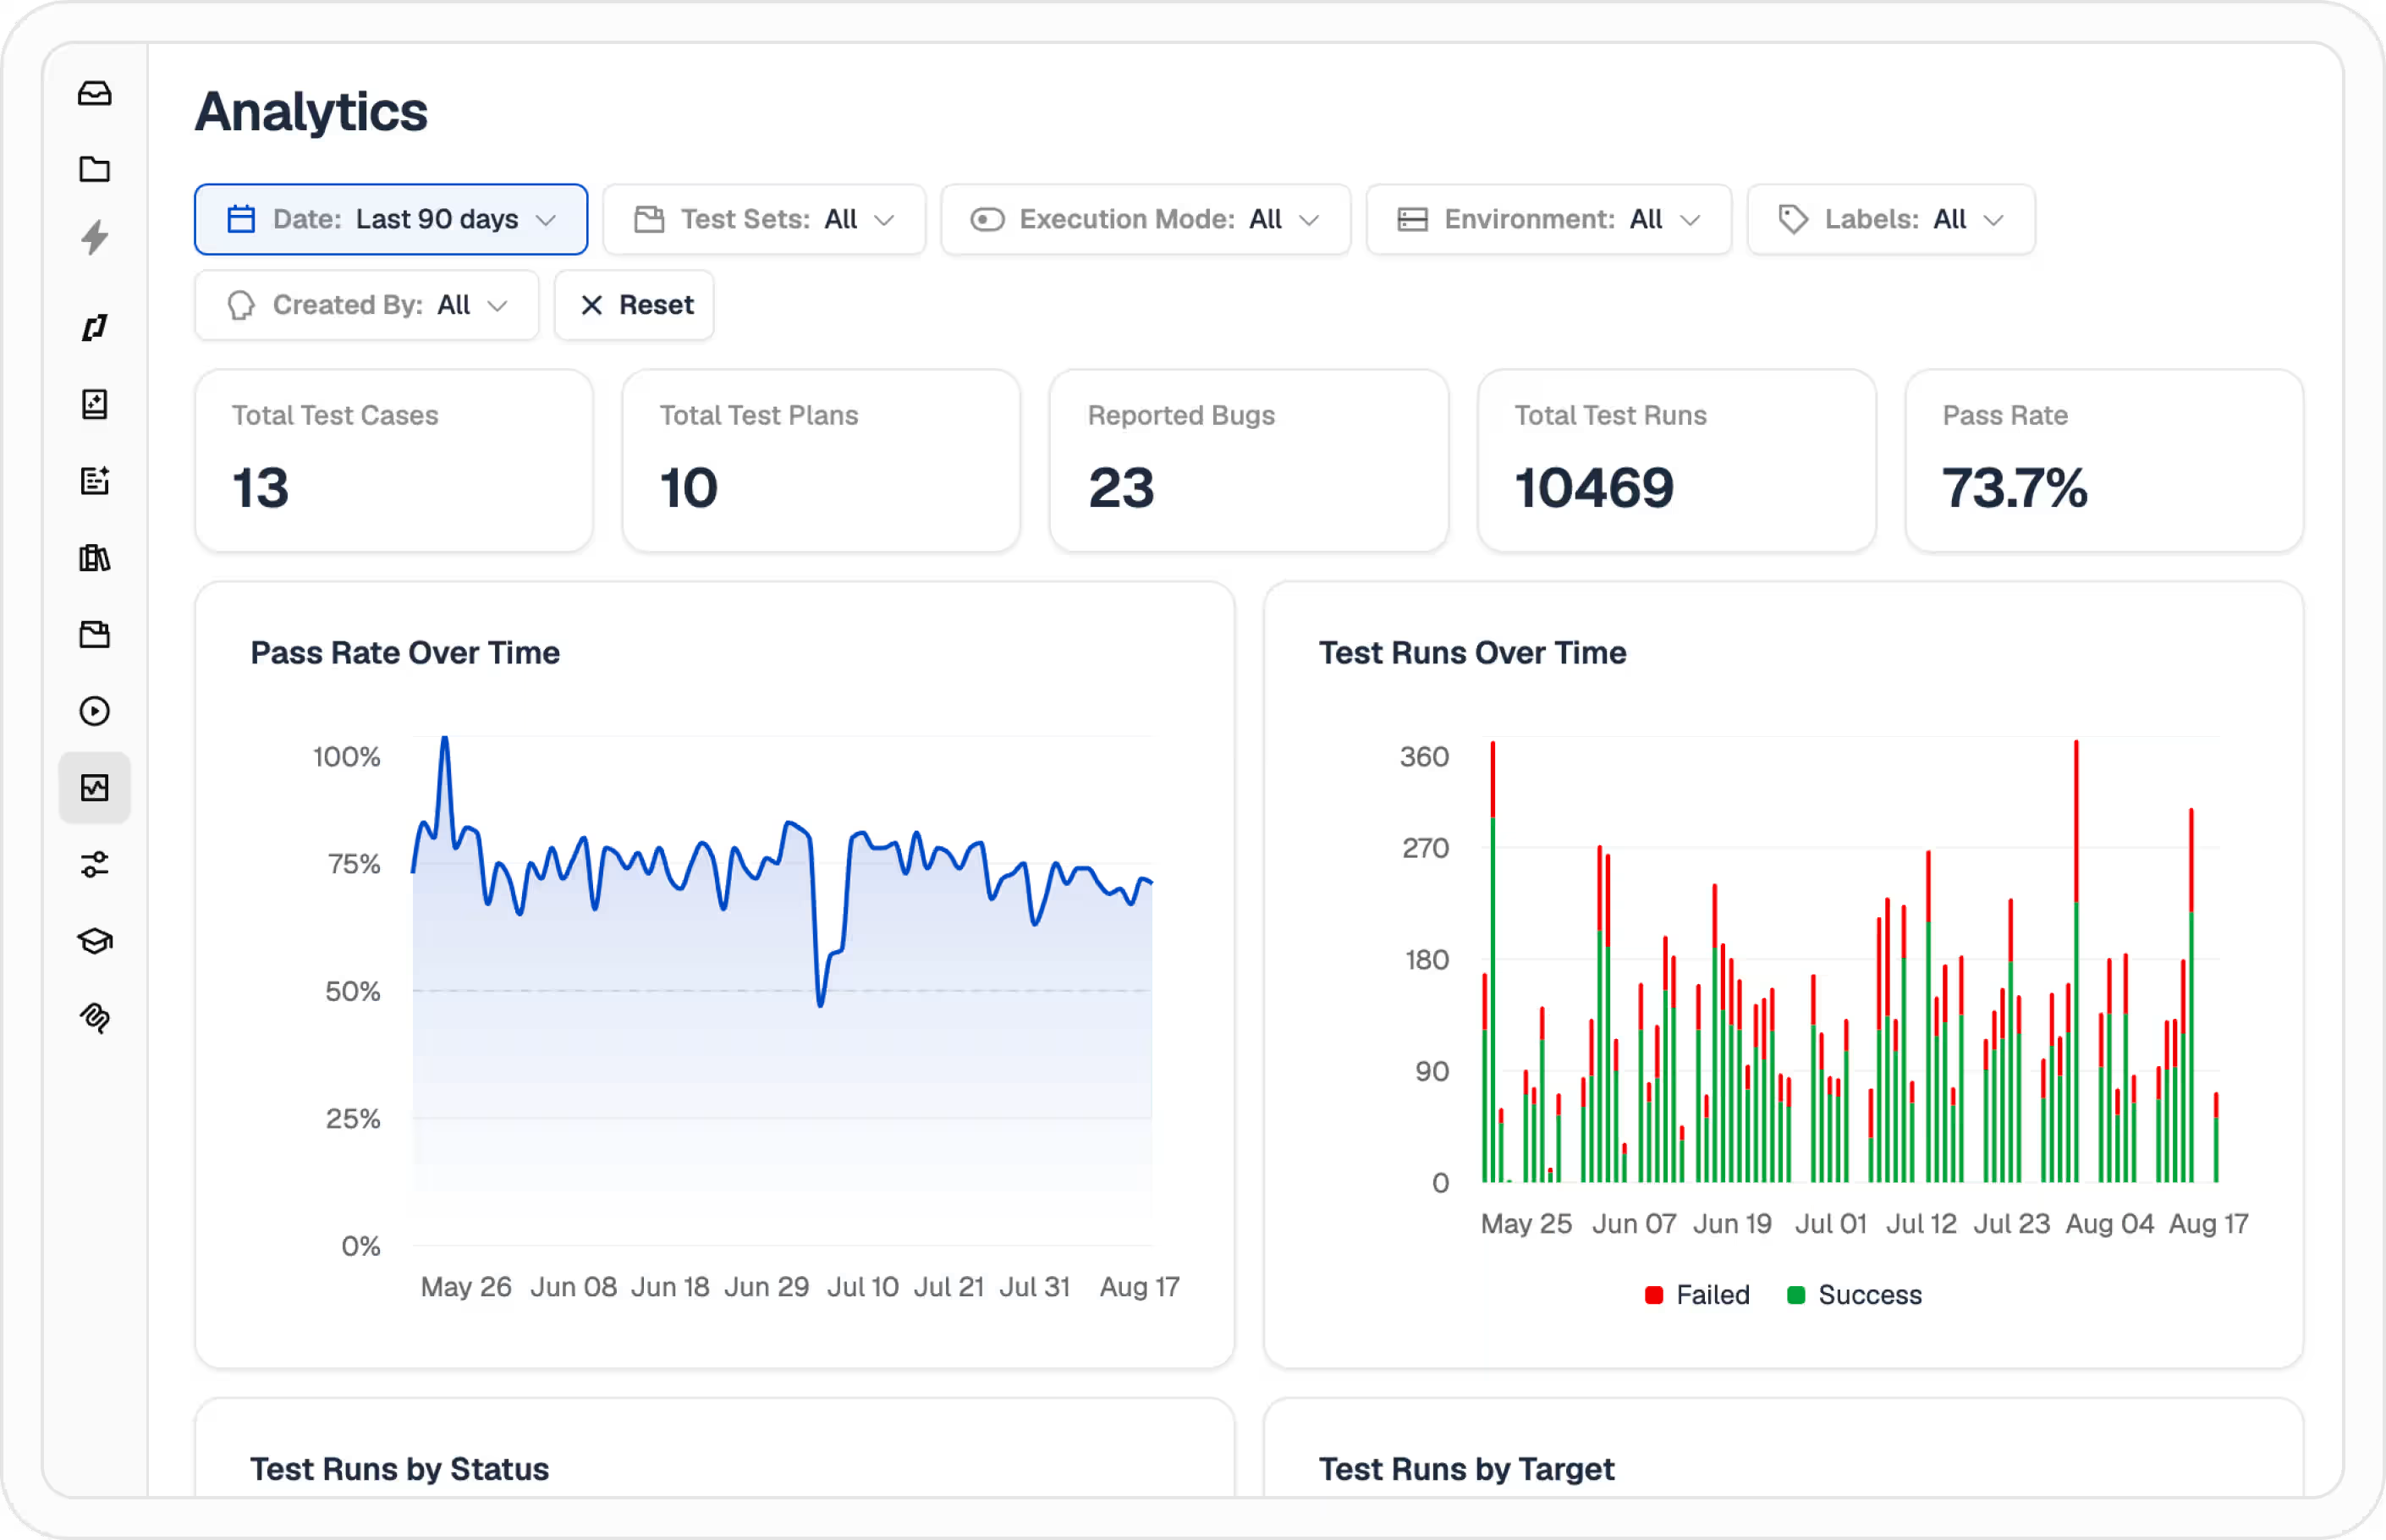
Thunders Analytics brings your test results into one place. Track pass rates, failures, and run volume over time, build the dashboards your team needs, and ask questions about your data in plain language.
One place for your test results
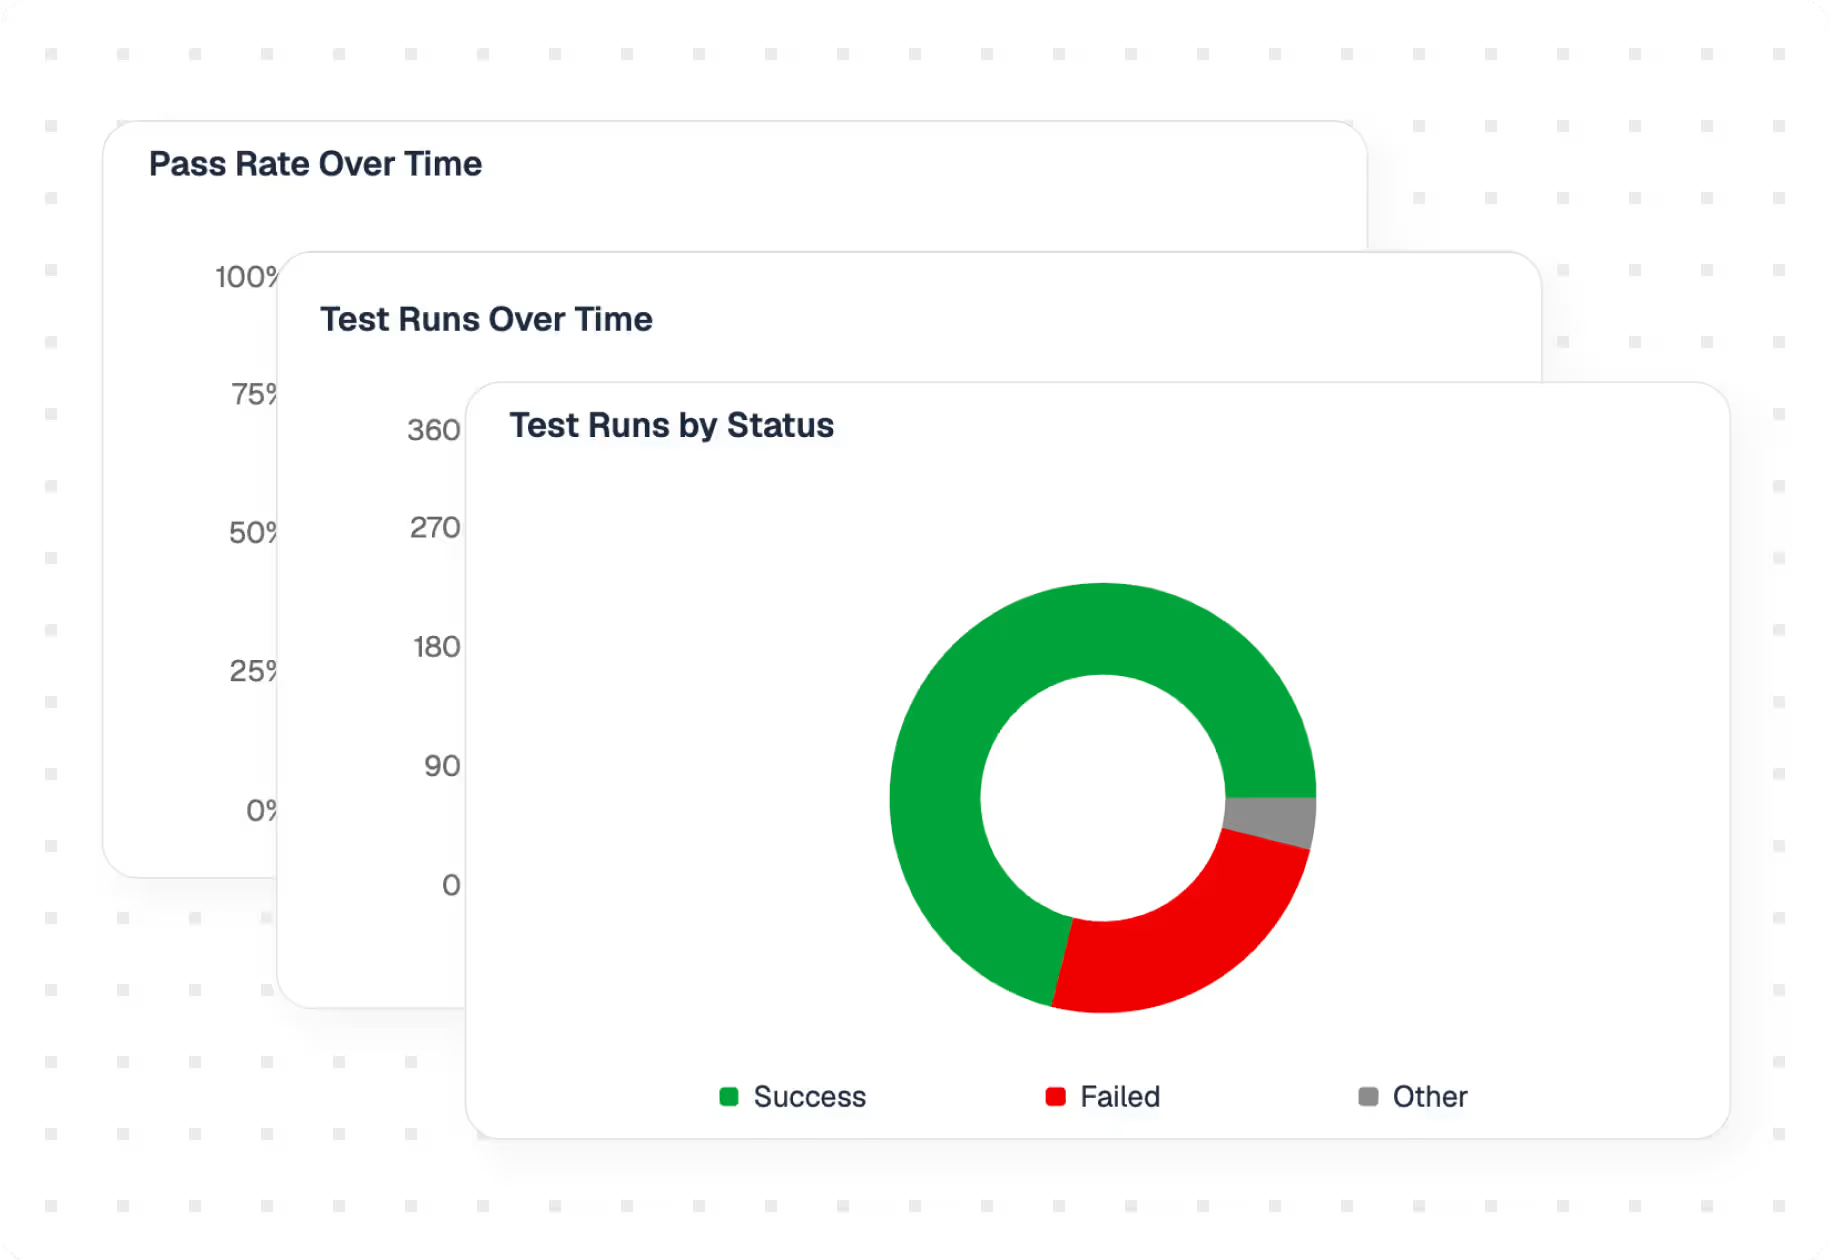
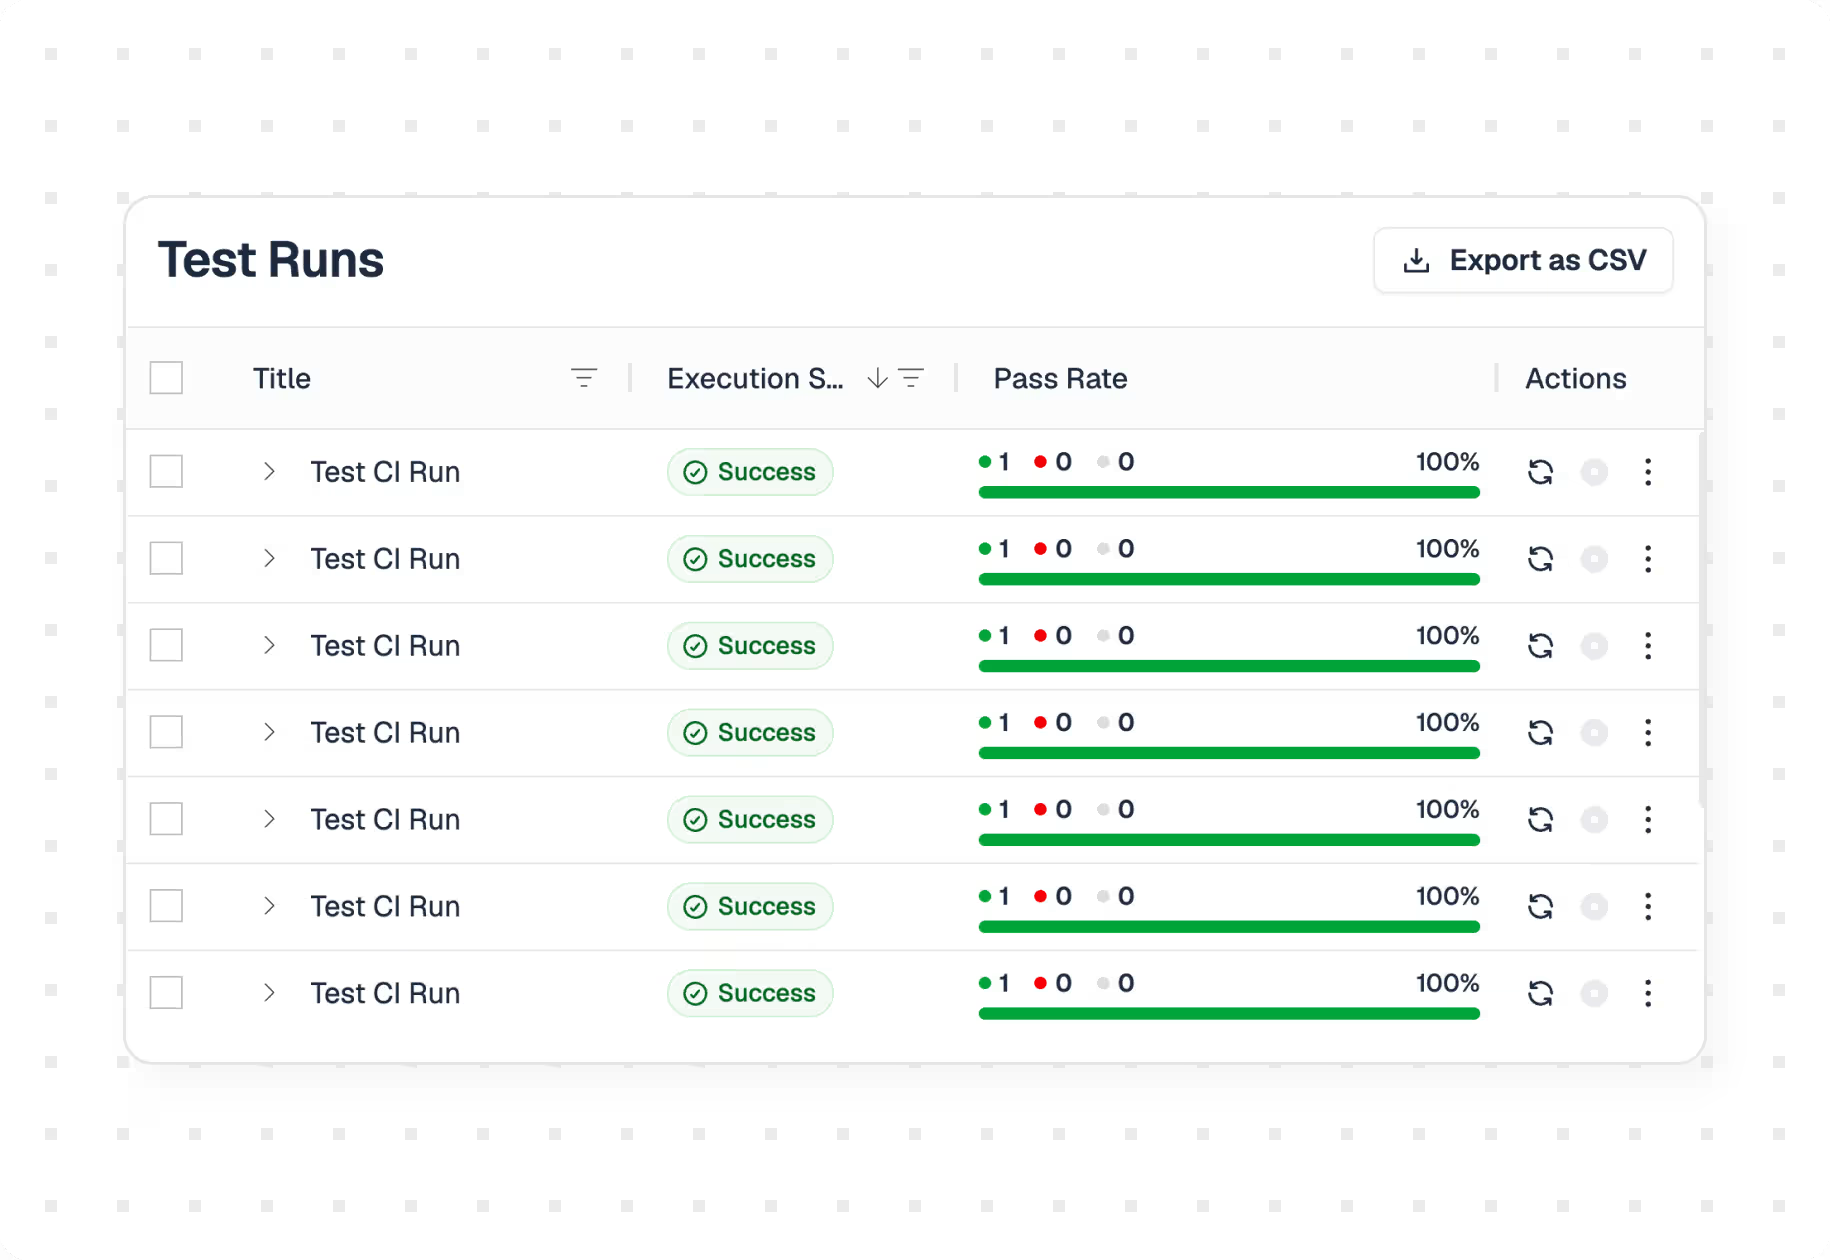
Checking how testing is going usually means opening runs one at a time and keeping track of the details yourself. Thunders Analytics collects that data for you and shows it as trends. You can see whether pass rates are improving, where failures are concentrated, and how testing is scaling across the team.
Track test health over time
Activity overview:
See testing volume and trends for the whole project in one view, without opening runs individually.Execution trends:
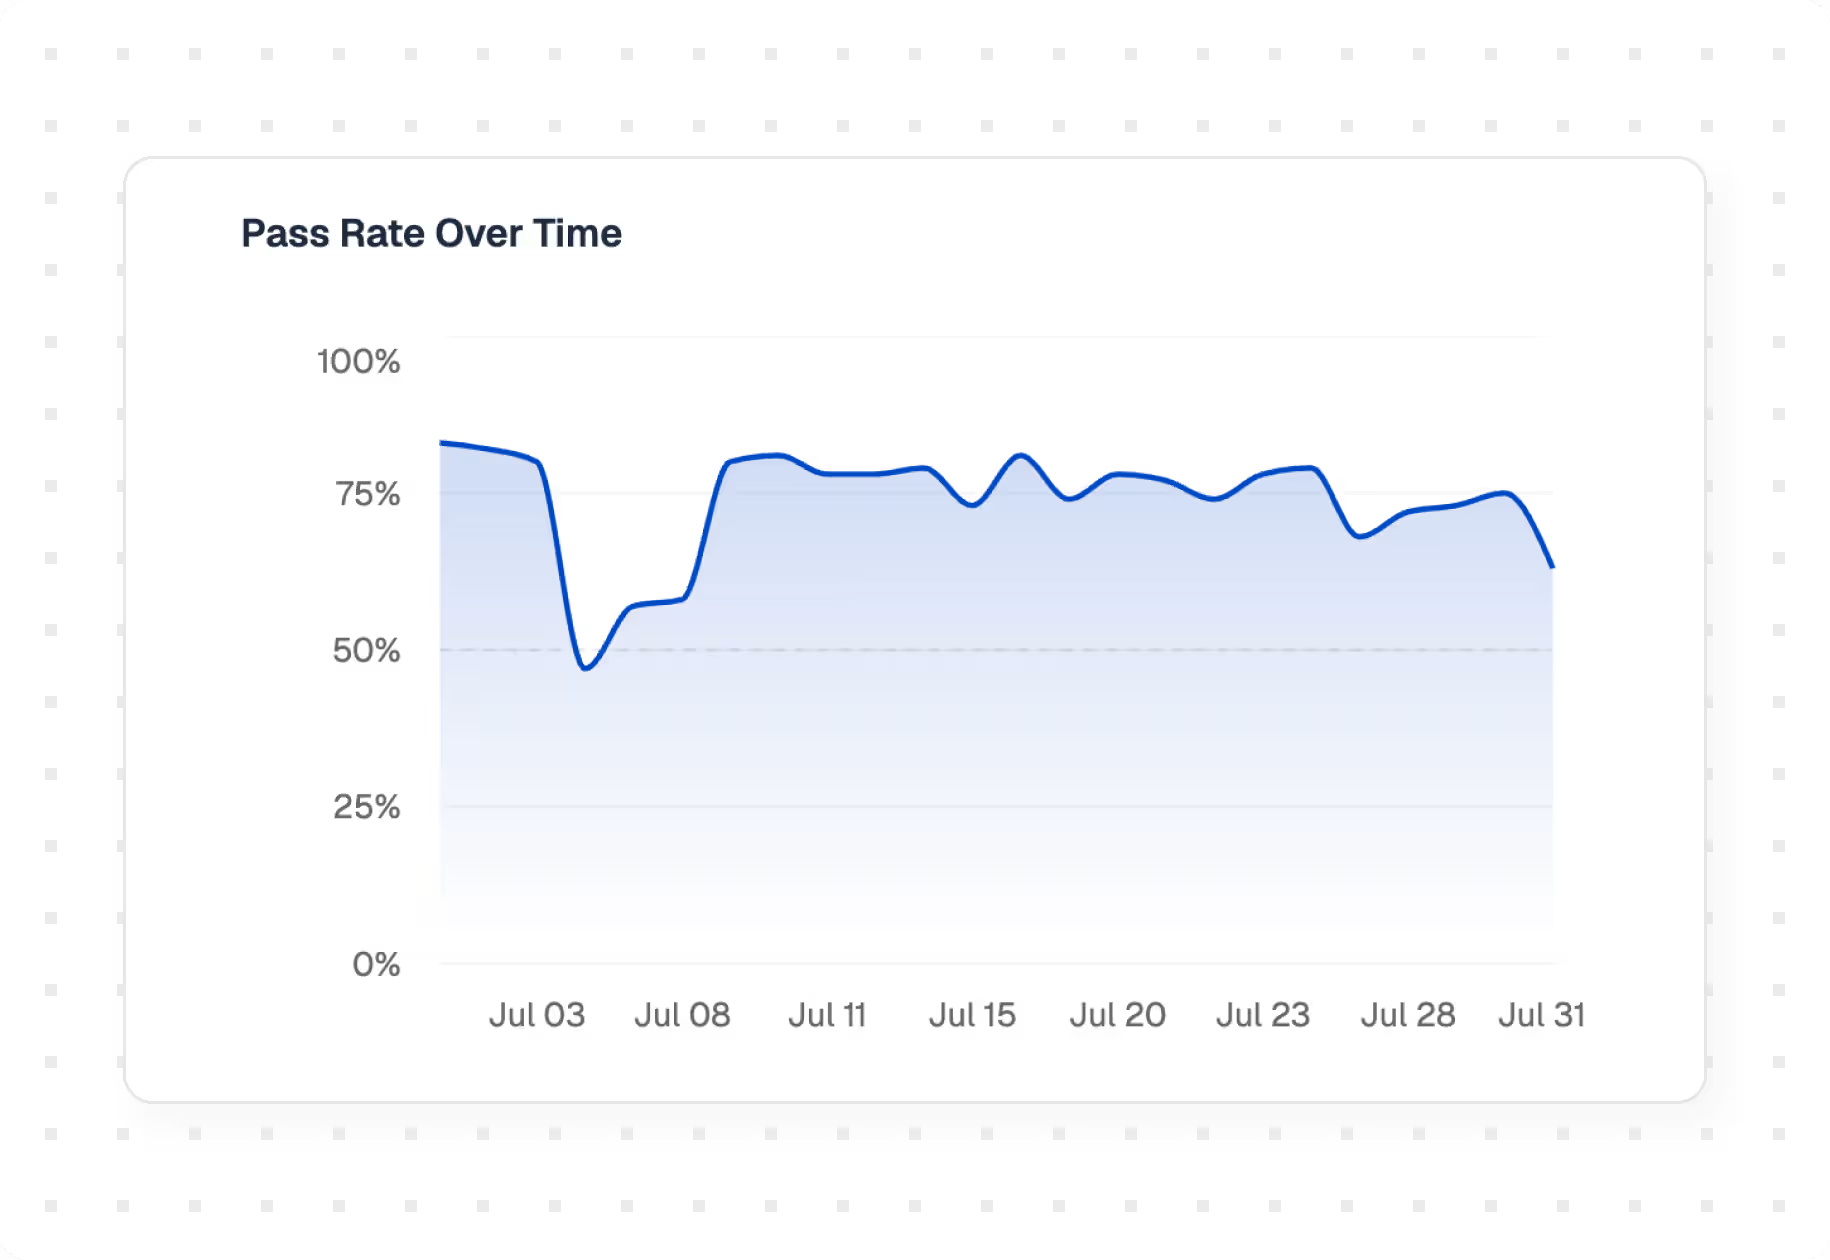
Follow pass rates, failure rates, and run volume across days and weeks, so changes in test health show up early.Team usage:
See how testing is scaling, including who is running what and how often.
Why teams use it
Consistency you can check:
Results are tracked over time, so a passing build is backed by a record, not a single run.Cost you can plan for:
A daily view of credits consumed shows what testing costs as volume grows.A clear record:
Analytics keeps a record of what was tested and the outcome, held by the system that ran the tests.
See quality across every project
Macro to micro:
Roll quality up across every project, or drill down to a single failing step.Ask a question, get the chart:
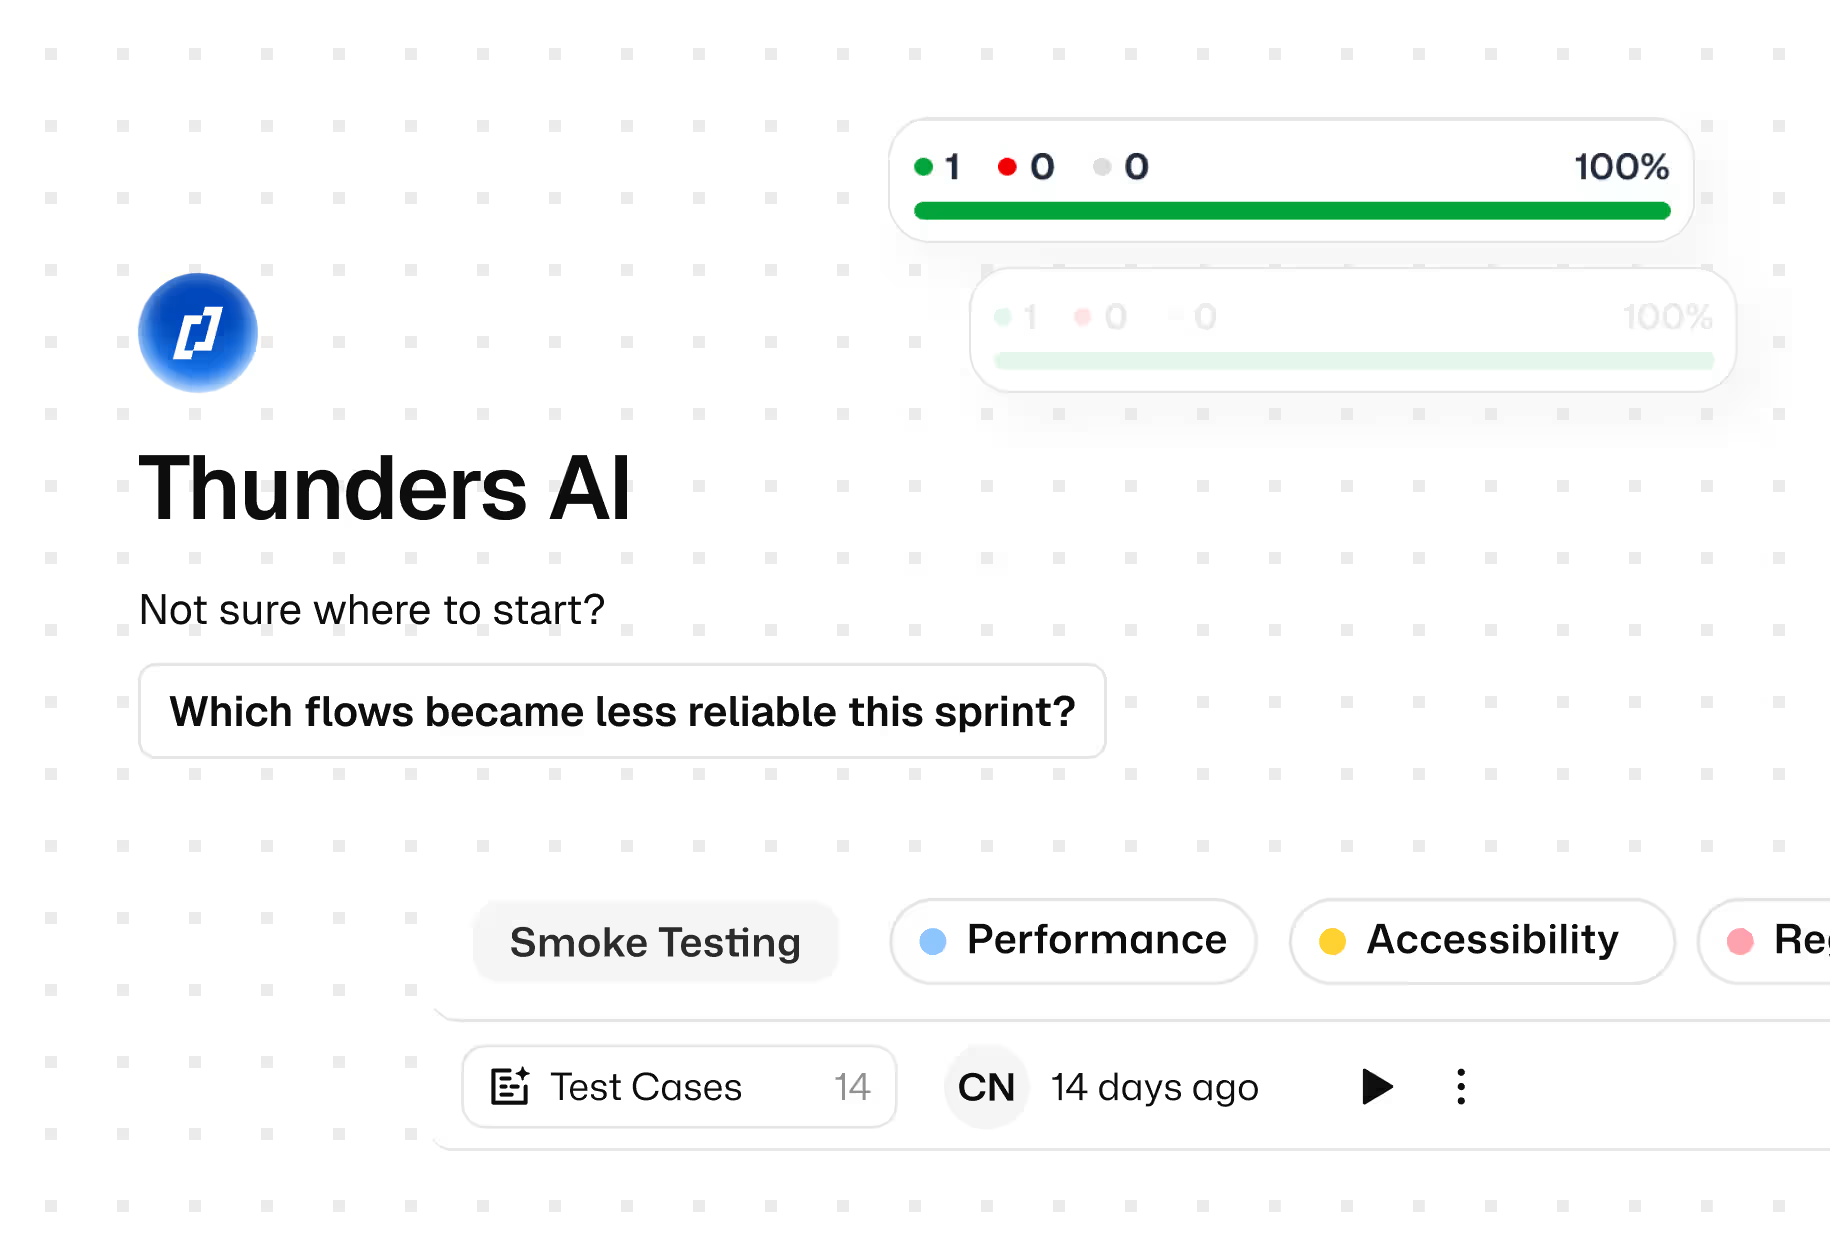
Thunders AI will answer questions about your test data in plain language. Ask something like which flows became less reliable this sprint, and it returns the answer along with the chart behind it. No query to write, and no dashboard to set up first.Monitoring and alerts:
Set thresholds on the metrics you track and get notified when one moves.
Discover Thunders' features
Ready to ship faster with smarter testing?